
B4:H7
Strategy Compare — same property, four ways to run it
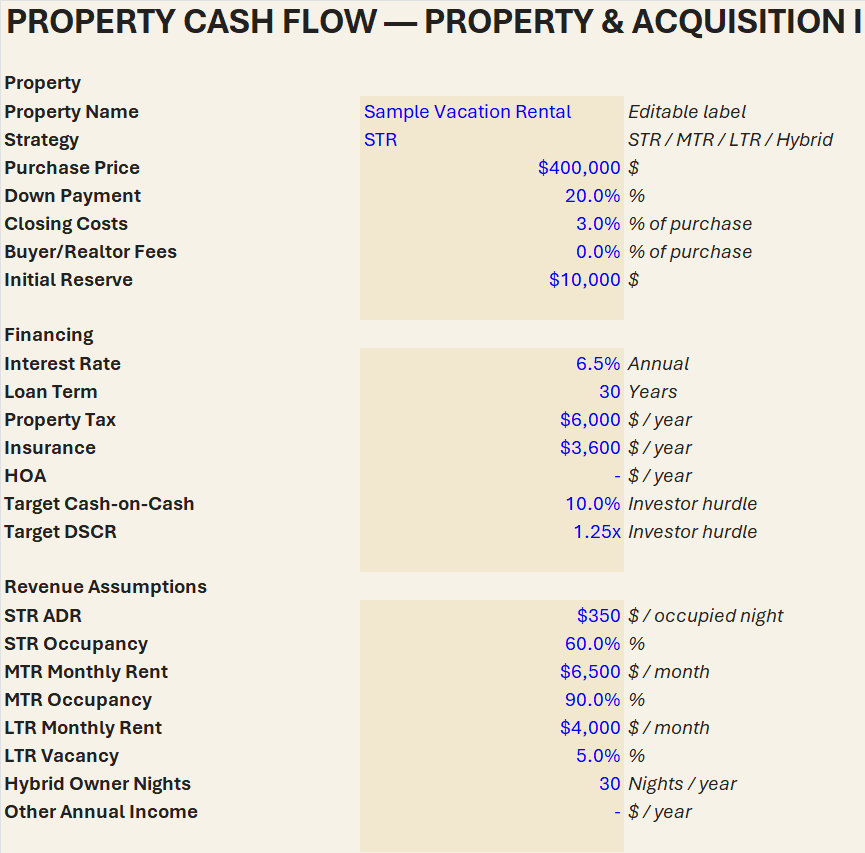
A rental & investment property analyzer built in Excel. Enter the numbers once — price, financing, revenue, costs — and see the Deal Score, the maximum price your own hurdles support, and what happens if you're wrong.
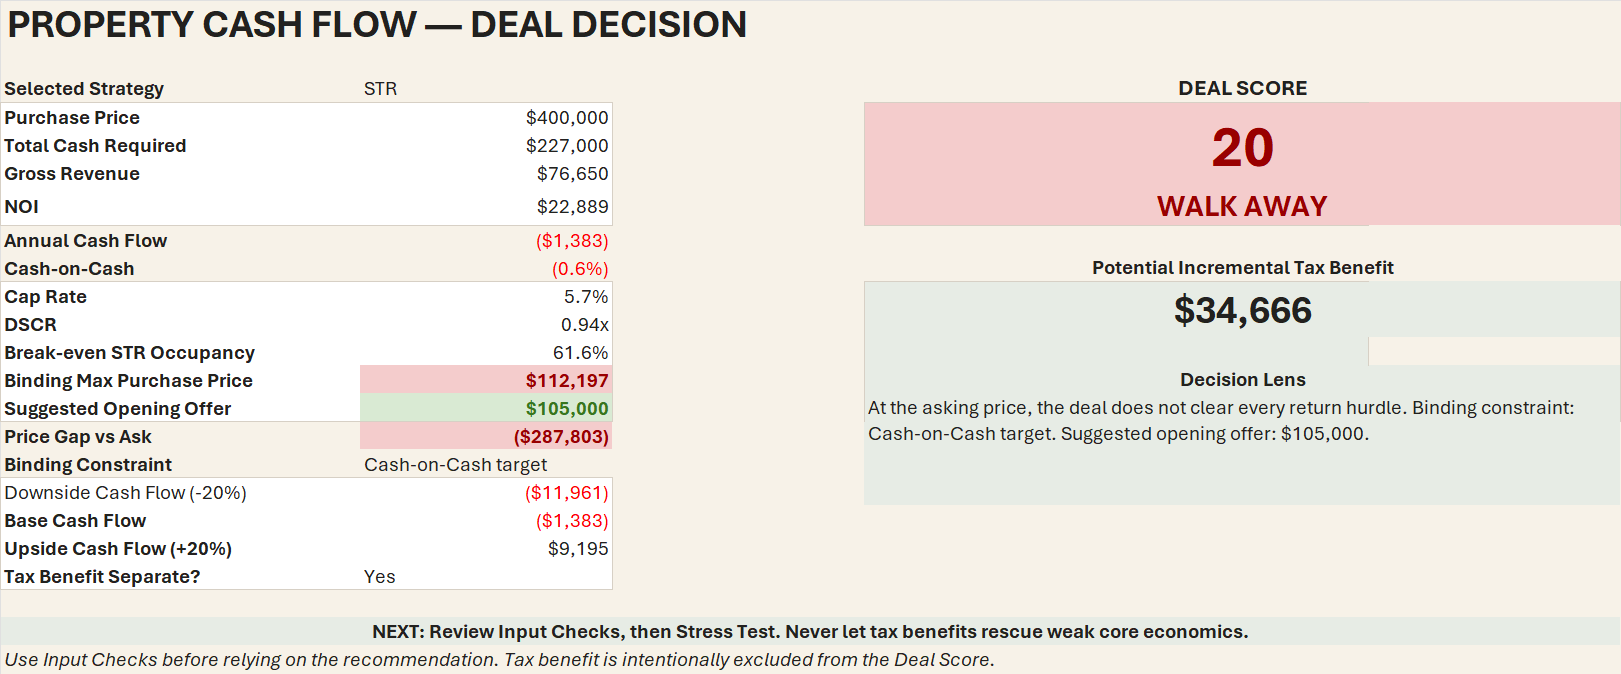
One composite number from cash-on-cash, DSCR, cap rate, price discipline and downside resilience — plus a plain-English STRONG BUY / BUY / BORDERLINE / WALK AWAY call.
The highest price your own return hurdles actually support, which hurdle is the one holding you back, and a suggested opening offer.
The same property run as STR, MTR, LTR and an owner-use hybrid, side by side — ranked by cash-on-cash, not just top-line revenue.
Down payment and interest-rate scenarios in one table, so you see the cash-flow cost of every point of rate before you lock one in.
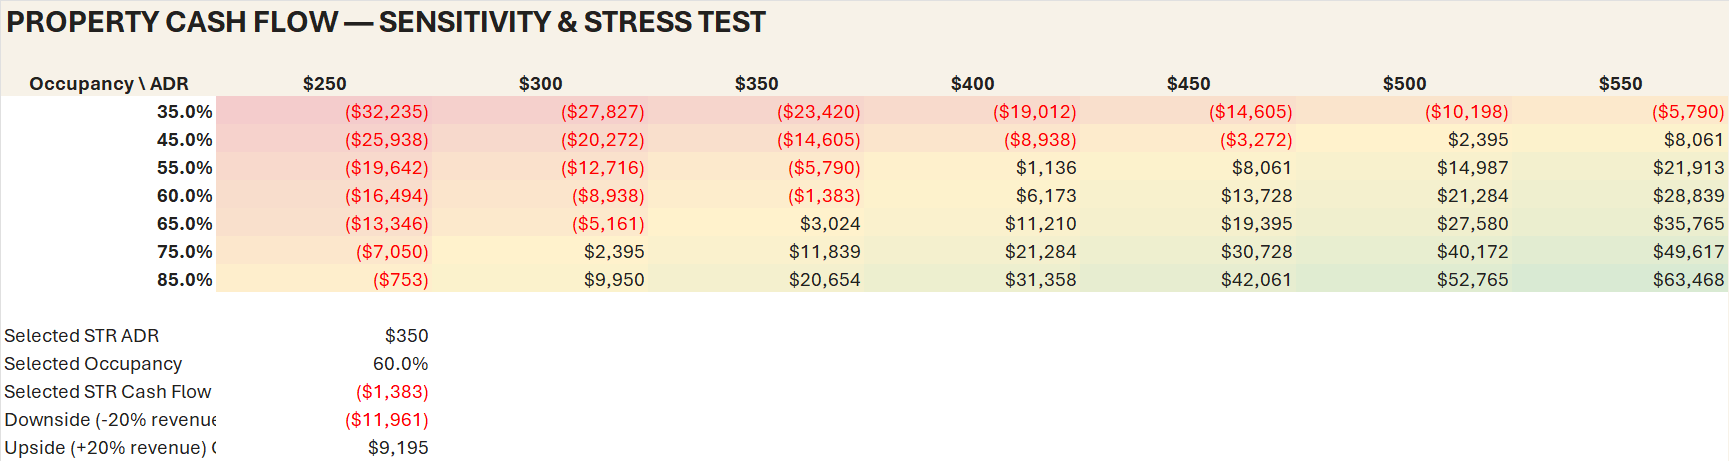
An occupancy-by-rate grid, plus multi-shock scenarios — revenue down, expenses up, a rate shock at refinance — so the downside isn't a surprise.
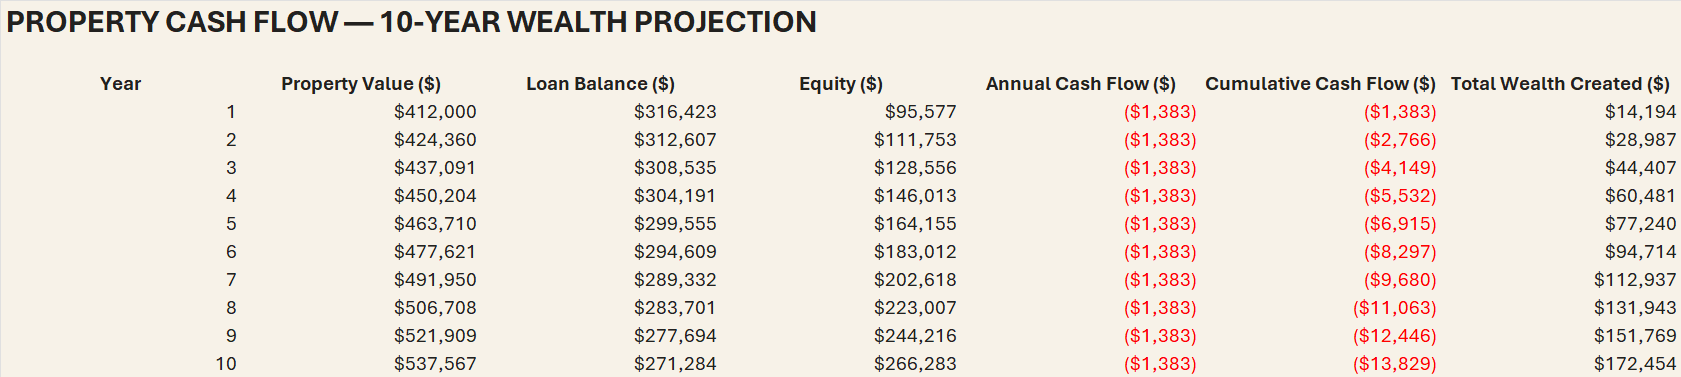
Equity build, loan paydown, and net proceeds at year 3, 5, 7 and 10 — selling costs and remaining debt included.
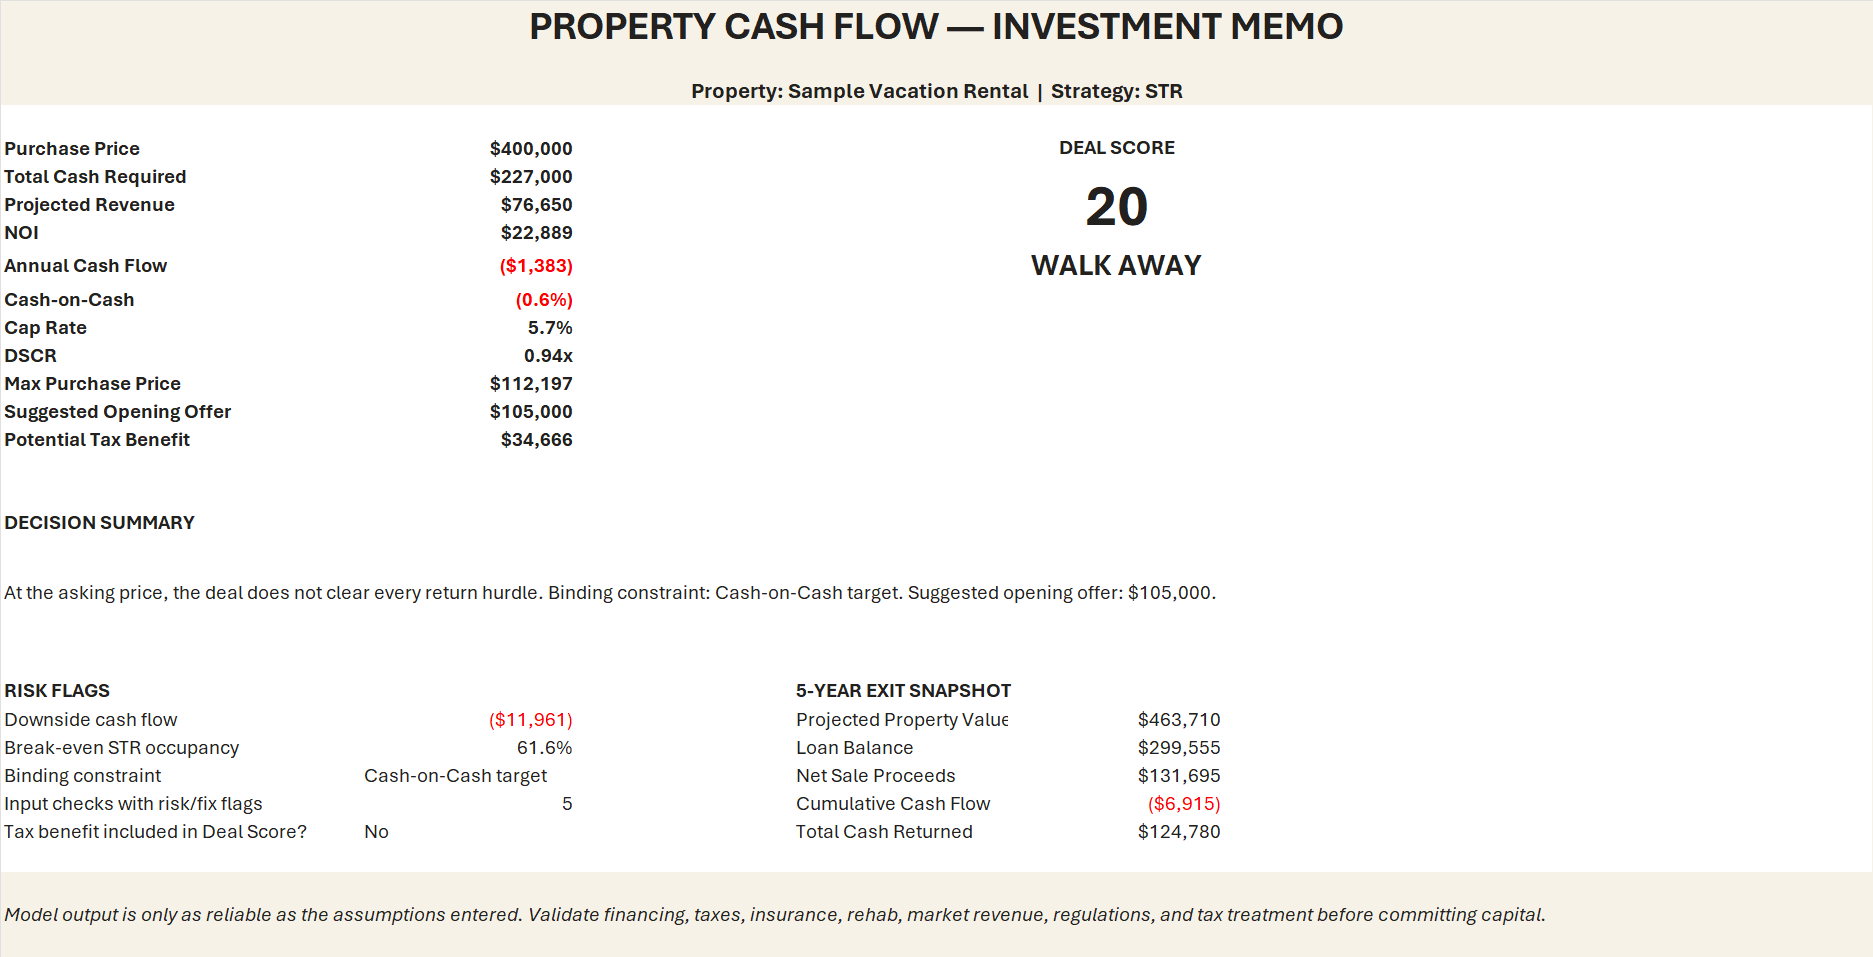
A one-page summary to print or share, plus an optional cost-segregation tax benefit tab — kept separate so a tax assumption can never rescue a weak deal.

Microsoft Excel for desktop. Tested in Microsoft 365 Excel, build 16.0.20326, on Windows 11 — every formula recalculated, saved and reopened with no errors. Excel is not included. Google Sheets is not supported.
Individual U.S. property buyers comparing assumptions before a purchase — short-, mid- or long-term rental investors, and flips.
No. It's an analytical tool that runs on the numbers you enter — not an appraisal, a guaranteed-income forecast, or investment, lending, legal or tax advice.
All sales are final — it's an instant digital download. If the file fails to open, email propertycashflowmethod@gmail.com and we'll make it right.